

SDK v7.x · Last verified March 2026 · iOS · Android · Web · Flutter
Speed run — just the code
Speed run — just the code
- Impressions — total number of times the post was viewed (same user can contribute multiple impressions)
- Reach — number of unique users who viewed the post
After completing this guide you’ll have:
- Post impression tracking firing on every feed scroll event
- Unique reach (
impression) and total views (markAsViewed) both captured - A “Who viewed this” list queryable per post for creator dashboards
Quick Start: Record a View and Read the Counters
Step-by-Step Implementation
1
Record impressions as posts scroll into view
Call Full reference → Post Impressions
markAsViewed() when a post becomes meaningfully visible. In web apps, use an IntersectionObserver; in native apps, use your list’s viewability callbacks. Aim for a threshold of ≥50% visible for at least 1 second to avoid counting rapid scroll-past views.2
Display impression and reach counts
Read Full reference → Post Impressions
post.impression and post.reach from the live post object. Both update in near-real time as views come in.3
Query the list of users who viewed a post
Get a paginated list of every unique user who reached a post — useful for “Seen by” UI, audience profiling, and creator insights.Full reference → Post Impressions
4
Build a creator dashboard card
Combine impressions, reach, reaction count, and comment count into a compact analytics card shown on the creator’s post detail view.
Analytics Metrics Reference
Connect to Moderation & Analytics
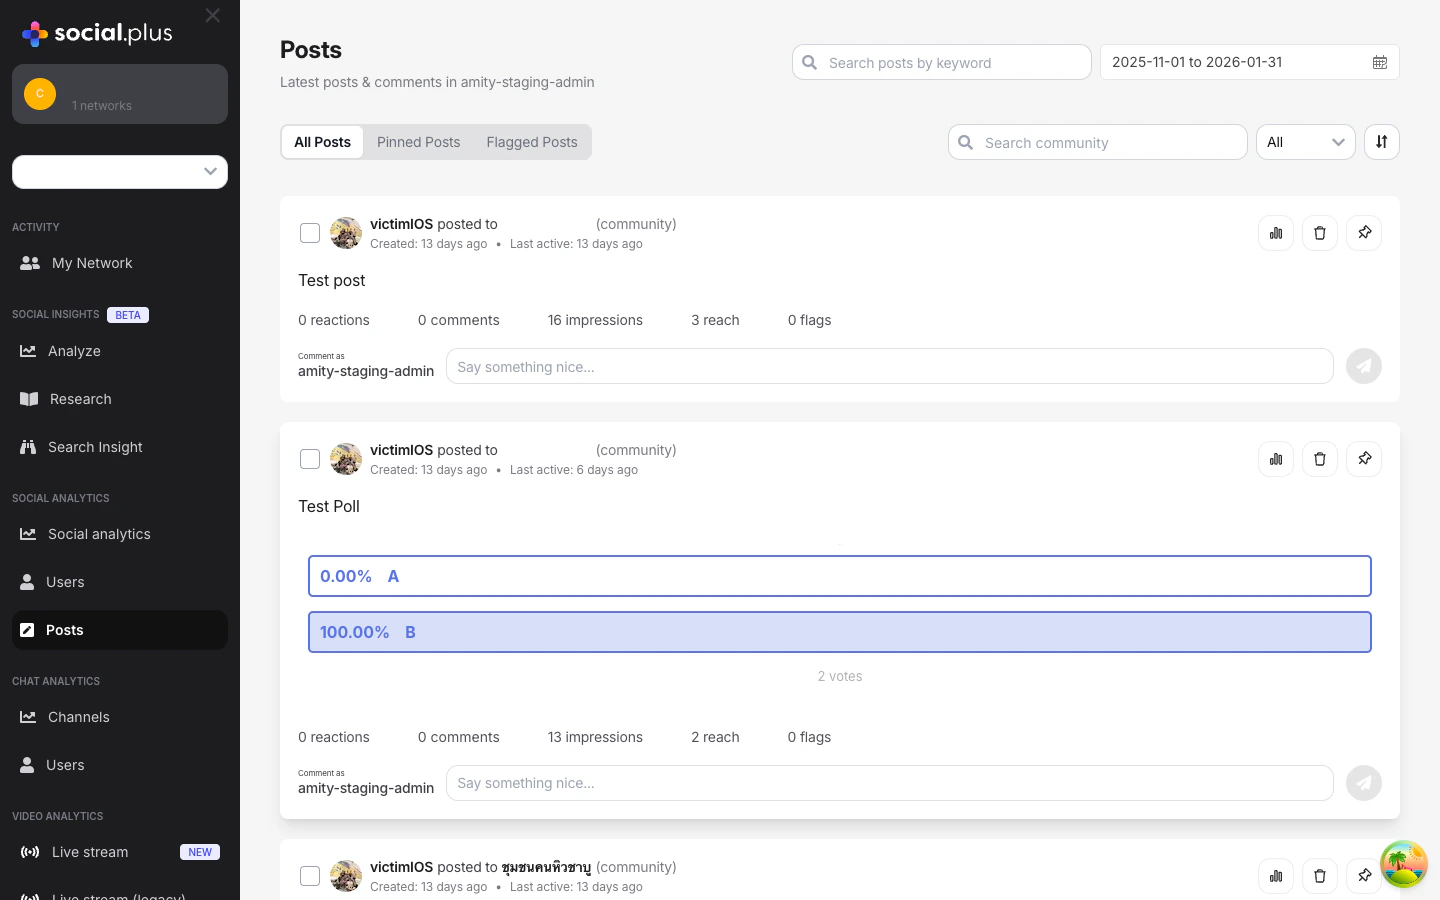
Admin Console — Post analytics dashboard showing impressions, reach, and engagement metrics
Analytics Console
Analytics Console
Impression and reach data aggregates across all posts and is visible in Admin Console → Analytics → Content. Filter by community, date range, or content type to spot high-performing content.
Story impressions
Story impressions
Stories have their own impression tracking via the Story SDK — the same impression/reach concept applies.→ Stories & Ephemeral Content
Webhook: content performance
Webhook: content performance
Although there’s no real-time webhook per impression, you can combine
post.created and post.updated webhooks with your own analytics pipeline to build server-side engagement scoring.→ Webhook EventsCommon Mistakes
Best Practices
When to call markAsViewed
When to call markAsViewed
- Feed scroll: fire when ≥50% of the post card is visible for ≥1 second
- Post detail view: fire immediately on open — the user navigated intentionally
- Clip reel: fire when the clip starts playing (it’s clearly in focus)
- Don’t fire on posts that are briefly visible during a fast scroll-to-top gesture
Non-blocking analytics
Non-blocking analytics
markAsViewed()is a fire-and-forget call — neverawaitit in a render path- If it fails due to network conditions, don’t retry in the same session; impressions are best-effort
- Impression accuracy is near-real time; don’t expect sub-second updates in the dashboard
Privacy and transparency
Privacy and transparency
- If your app shows creators a “Seen by” list, disclose this to viewers in your privacy policy
- The
getViewedUsersAPI returns user objects — only show identifiable information (name, avatar) where appropriate for your app’s context - Respect user block relationships: don’t show a blocked user’s name to a creator in the viewed list
Dashboard design
Dashboard design
- Lead with reach (unique viewers) as the headline metric — it’s more meaningful than raw impressions for most creators
- Show a 7-day or 28-day trend line, not just the current snapshot
- Display engagement rate (reactions + comments / reach) to help creators judge content quality
- For communities with many posts, sort by reach descending to surface top-performing content first
Next Steps
Your next step → Advertising & Monetization
You’re tracking views — now monetize that attention with native ads in the feed.
Short-Form Video Clips
Track impressions on clip posts as users scroll a vertical reel
Stories & Ephemeral Content
Story-specific impression and reach analytics
Build a Social Feed
The feed query that powers impression tracking at scale